Take your data analysis capabilities to the next level
Community Data Solutions has long been aware of the vital role strong data reporting plays in the sector and how challenging it is for organisations to have all the data they require at their fingertips for business planning and for improved service delivery.
The history of community services reporting in Australia has been focused very much on the needs of funding bodies, that is, Government agencies in the main. Data management, collection, and reporting varies with the changes in Government Department’s needs. This emphasis has made it difficult for community sector agencies themselves to develop effective reports to manage their own services and their own business needs. With the introduction of individualised funding, community organisations need much more information on productivity levels, costs and managing high quality data for improved service delivery.
Data Visualisation services offer many benefits to organisations and provide decision making tools previously not available to NGOs including:
- Improved capacity to identify patterns between operational and business activities. Using advanced analysis tools enables users to visualise connections between operating conditions and business performance in real time. For instance productivity drop patterns in counselling session rates can be quickly identified and tracked down to specific dates, time period, individuals or poor management. Early identification can assist NGOs to address inefficiencies faster than ever before.
- Recognise emerging trends in real time. The volume of data that organisations are able to gather about clients and conditions can provide valuable insights into market segmentation opportunities. For example, identifying poverty trends in particular areas allows organisations to mobilise aid faster and more effectively and overlaying increase in number of service enquiries against declined funding trend can assist CEOs to prepare strong case for additional funding or resources.
- Manipulate data and interact directly with information. Data visualisation greatest strength is the ability to communicate insights via instant analysis and filtering capabilities. Using an Excel spreadsheet or printed report delivers a fixed activity view that can be tabled at board meetings. However, the report cannot inform the board the reason for a decline in particular service delivery rate and may even be out of date by the time the data was presented. Using data visualisation service organisations can investigate trends, develop powerful advocacy cases and improve strategies. The ability to pull the relevant data when and where required equip NGOs to deal with complex changes in new ways.
- Understand client sentiment to improve service delivery. Imagine a report that combines service delivery information with client assessment data to portray clear patterns of dissatisfaction or distress amongst vulnerable communities. Such analysis, previously unavailable can now be extended to present the same information as trends report over prolonged date range and illustrate realistic collective impact picture. Data visualisation services empower users to improve visibility through investigative research and help organisations understand how reduction in service quantity or quality affects the communities they support.
- In-house analysis promotes efficiency. Traditionally, organisations didn’t measure productivity and service quality or were required to hire external analysts for services beyond their technical capabilities. With data visualisation service expertise can be developed within the organisation. In-house analysis delivered in a timely and cost effective way allows organisations to plan and develop independently. What was previously an unaffordable service is now a sensible investment that can pay dividends by advocating organisational changes to promote efficiency and savings.
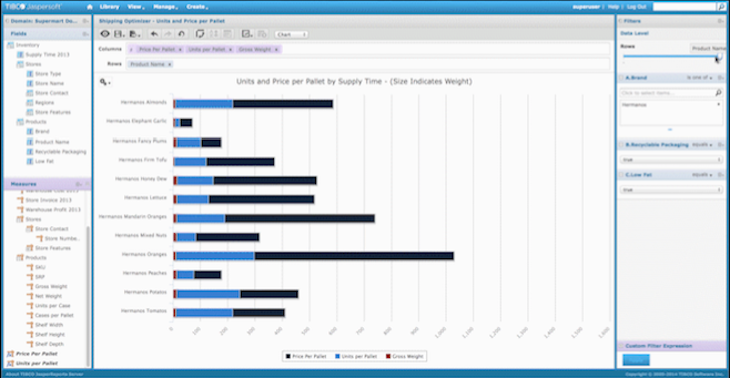
Community Data Solutions delivers a data visualisation and reporting software entitled CommunityBI to help organisations take control over reporting and service analysis requirements. The tool utilises Tibco’s Jasper report server cloud analytics technology to allows agencies to build their own reports and have these displayed in a dashboard for ease of analysis. Reports can be scheduled for delivery as Excel sheet or PDF file via email on a regular basis and a smartphone app is available to view real time data anytime anywhere. The software is smartphone friendly and allows users to measure individual clients progress and profile of service delivery, as well as aggregate key performance data of programs filtered by sites, teams and client budgets.
CommunityBI is offered as a data visualisation tool integrated with Community Data Solutions CRM. This data visualisation solution will be further developed to incorporate multiple data sources for wider aggregation of agency’s data. CommunityBI has an affordable installation costs and is priced for very small agencies right through to the very large. Community Data Solutions supports the product with training, user guide information including training videos and a report development service for organisations seeking specialist assistance.
Recent Comments